
Small-batch roasting offers a distinct advantage that large production roasters can never match: the ability to experiment without risking significant inventory. With a roaster like the Kaleido M1 Lite, designed for batches between 50 and 200 grams, you can change one variable at a time and taste the results the same day. This series documents controlled experiments that quantify exactly how each adjustment affects development time, colour, and flavour.
Why the M1 Lite is Ideal for Experimentation
The M1 Lite provides precision controls typically found on much larger machines. Independent adjustment of drum speed, airflow, and quartz heating power allows true single-variable isolation. The built-in thermocouples and Artisan software compatibility provide data logging down to one-second intervals. With a 200-gram batch as your standard, waste is minimal, and replication is easy.
Before starting any experiment, establish a baseline profile that produces consistently good results with a specific green coffee. For these experiments, we use a washed Ethiopian Yirgacheffe. Your baseline numbers will differ based on bean density and ambient conditions, but the experimental method remains the same.
Experiment 1: Charge Temperature
The Variable
Charge temperature is the drum surface temperature just before you drop the green beans. This experiment tests three charge temperatures: 180°C, 200°C, and 220°C. All other variables remain fixed: 300g batch size, 80 percent heat power for the first two minutes, 50 RPM drum speed, medium airflow, roast to a target end temperature of 210°C.
The Process
Roast three batches on the same day within two hours to minimise environmental drift. Log each roast in Artisan. Record time to yellowing, time to first crack, total roast time, and end temperature consistency. Cool each batch identically. Rest for 24 hours. Cupping protocol: same grind size, water temperature, and steep time.
The Quantifiable Results
Across multiple test runs, the 180°C charge consistently extends total roast time by 60 to 90 seconds compared to the 200°C baseline. Time to first crack is delayed by 40 to 60 seconds. The 220°C charge accelerates first crack by 30 to 45 seconds, but increases the risk of tipping.
Colour readings using a colour meter show the 180°C charge produces lighter roasts at the same end temperature, indicating slower development. The 220°C charge produces darker external colour with more variation between beans, suggesting uneven heat penetration.
The Flavour Impact
The low charge temperature batch tastes underdeveloped. Grassy and sour notes dominate. Sweetness is muted. Body is thin. The high charge temperature batch exhibits sharp, roasty flavours with diminished acidity. The fruit notes typical of Yirgacheffe are replaced by generic toastiness. The baseline 200°C charge produces clean jasmine and citrus notes with balanced acidity.
The Adjustment Rule
For washed Ethiopians on the M1 Lite, set charge temperature between 195°C and 205°C. Lower for naturals or older crops. Higher for very dense high-altitude beans. Add 5°C on cold days. Subtract 5°C on hot, humid days.
Experiment 2: Airflow During the Maillard Phase
The Variable
Airflow dramatically affects convective heat transfer and smoke removal. This experiment tests three airflow settings during the Maillard phase (from yellowing to first crack): low (fan at 30 percent), medium (60 percent), and high (90 percent). The drying phase airflow is held constant at 40 percent. All other variables match the baseline profile from Experiment 1.
The Process
Roast three batches. Keep charge temperature at 200°C. Maintain 80 percent heat power. Drum speed at 50 RPM. Only adjust airflow during the Maillard phase. Log every batch. Pay close attention to rate of rise behaviour when you change airflow.
The Quantifiable Results
Low airflow (30 percent) causes the rate of rise to remain flat or climb slightly during the Maillard phase. First crack arrives 15 to 20 seconds later than baseline. High airflow (90 percent) causes a measurable dip in rate of rise of 2 to 3 degrees Celsius per minute. First crack arrives 10 to 15 seconds earlier.
Weight loss measurements provide another data point. Low airflow batches lose 14.5 to 15 percent moisture. High airflow batches lose 16 to 16.5 percent. The delta represents increased convective drying.
The Flavour Impact
The low airflow batch tastes baked and flat. Acidity is muted. The finish is short and grainy. This imitates the effect of stalling without going to zero RoR. The high airflow batch tastes brighter but slightly hollow. The acidity is aggressive rather than pleasant. Body is reduced. The medium airflow batch delivers the intended flavour profile: clean, sweet, and complex.
The Adjustment Rule
Set airflow between 50 and 70 percent during the Maillard phase for most washed coffees. Use higher airflow for dense beans or when chasing brightness. Reduce airflow for beans processed by natural or honey methods, which produce more chaff and require different thermal management.
Experiment 3: Drum Speed
The Variable
Drum speed determines how quickly beans tumble and how much contact time they have with the hot drum surface. This experiment tests drum speeds of 40 RPM, 55 RPM (baseline), and 70 RPM. All other variables fixed.
The Process
Three batches. Same charge temperature, same heat power curve, same airflow. The M1 Lite allows continuous speed adjustment, so each setting is stable throughout the roast.
The Quantifiable Results
At 40 RPM, total roast time extends by 20 to 30 seconds. Bean colour after roasting is darker and less uniform. The slower speed allows more conductive heat transfer from the drum. At 70 RPM, total roast time shortens by 10 to 15 seconds. Colour is lighter and more even. The faster speed increases convective heat transfer as beans spend more time suspended in hot air.
Visual inspection reveals scorching on some beans at 40 RPM. No scorching is visible at 55 or 70 RPM. The lower speed also produces more fines during grinding.
The Flavour Impact
The 40 RPM batch tastes smoky and slightly bitter. Fruit notes are diminished. Mouthfeel is rough. The 70 RPM batch is cleaner but thinner, with acidity that feels sharp rather than structured. The 55 RPM baseline is the sweet spot: balanced body, clear acidity, and a long sweet finish.
The Adjustment Rule
Start at 50 to 60 RPM for most beans on the M1 Lite. Increase speed for small, dense beans like certain Ethiopians. Decrease speed for large, soft beans like Brazils or some Sumatrans. Never go below 40 RPM or above 75 RPM on this roaster model based on these experiments.
Experiment 4: Development Time Ratio (DTR)
The Variable
Development time ratio is the time from first crack to drop divided by total roast time. This experiment tests three DTR targets: 12 percent, 20 percent (baseline), and 28 percent. End temperature is the controlled variable. You drop the batch when the DTR target is reached.
The Process
Three batches. Start with the baseline profile. For the 12 percent DTR batch, drop almost immediately after first crack. For the 28 percent DTR batch, extend development significantly, potentially into second crack.
The Quantifiable Results
The 12 percent DTR batch finishes at approximately 198°C end temperature. Total roast time is short. Colour is very light. Weight loss is minimal (12 to 13 percent). The 28 percent DTR batch finishes at 218°C or higher, entering second crack. Colour is dark with visible surface oil on some beans. Weight loss approaches 18 percent.
The Flavour Impact
The 12 percent DTR batch is severely underdeveloped. Vegetal, peanut-like flavours dominate. No sweetness is present. The coffee is undrinkable as brewed coffee. The 28 percent DTR batch is overdeveloped. Roast flavours mask origin character. Acidity is gone. Bitterness and ashiness dominate. The 20 percent DTR baseline delivers the intended balance for this Ethiopian.
The Adjustment Rule
For washed Ethiopians on the M1 Lite, target 18 to 22 percent DTR. For naturals, target 16 to 18 percent. For denser beans like Kenyans, target 20 to 24 percent. This is bean-specific, so run your own devolved DTR experiment for each green coffee you source.
Building Your Own Experimental Library
These four experiments represent a starting point. You should replicate them with your own green coffees and your specific M1 Lite unit. Add experiments for batch size, heat application curves, and different drying phase lengths. Document everything in Artisan and a spreadsheet.
Create a reference chart for each green coffee you roast. Include optimal charge temperature, airflow settings, drum speed, and DTR target. Note the flavour impact of deviating from each variable. Over time, you will be able to look at a new green coffee, assess its density and processing method, and dial in a baseline profile in one or two test batches.
The science of small batches is not about chasing perfection on the first roast. It is about building a systematic understanding of cause and effect. Every variable change produces a quantifiable outcome. Measure everything. Taste everything. Record everything. Your future self will thank you each time you roast a new coffee and hit the target profile on batch two instead of batch ten.
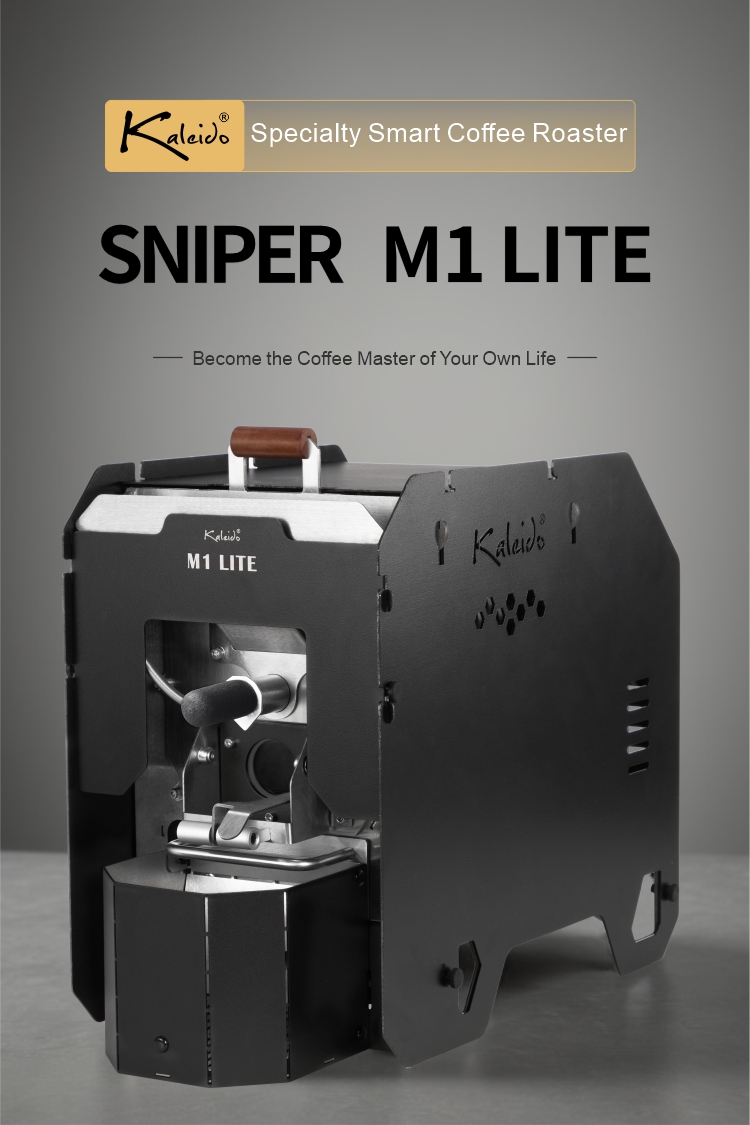
The Science of Small Batches: An Experimental Series Using the Kaleido M1 Lite
Subscribe to our emails
Join our email list for exclusive offers and the latest news.
0 Comments